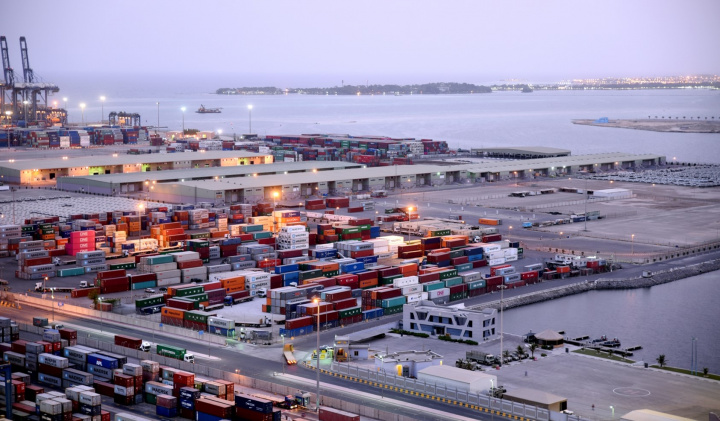
LPG imports from China, the world’s leading importer have been marginally higher so far in 2025. In its latest weekly report, shipbroker Banchero Costa said that “global LPG (liquified petroleum gas) trade has been steadily recovering in the past three years, following a very disappointing 2021. Total seaborne exports of LPG in JanDec 2024 increased by +4.4% y-o-y to 148.9 mln tonnes, according to vessel tracking data from LSEG. This follows the +2.4% y-o-y growth recorded in 2023, and the +4.4% y-oy growth in 2022. The first 6 months of 2025 have been even better, with global loadings increasing by +6.6% y-o-y to 77.3 mln tonnes, from 72.5 mln t in the same period of 2024. In Jan-Jun 2025, LPG exports from the USA increased a very healthy +8.2% y-o-y to 34.9 mln tonnes. The USA now account for 45.1% of global LPG exports. LPG exports from the GCC declined by -4.9% y-o-y in Jan-Jun 2025 to 18.4 mln tonnes. This included 6.8 mln tonnes from the UAE, 4.9 mln t from Qatar, 3.1 mln t from Saudi Arabia, 2.9 mln t from Kuwait, 0.5 mln t from Oman. Shipments from the GCC accounted for 23.8% of global exports. Exports from Iran surged by +36.6% y-o-y to 4.7 mln tonnes, and account for 6.1% of global loadings. Exports from Algeria also increased by +3.7% y-o-y to 2.9 mln t”.
According to Banchero Costa “in terms of imports, the top destination for LPG in Jan-Jun 2025 was Mainland China, accounting for 22.4% of global imports. Imports to China increased by +0.3% y-o-y in Jan-Jun 2025 to 17.1 mln t. Imports to the EU increased by +7.7% y-o-y to 11.3 mln t. The EU accounted for 14.8% of global seaborne LPG imports. Volumes into India increased by +11.9% y-o-y to 10.6 mln tonnes. Imports to Japan declined by -3.7% y-o-y to 5.1 mln t in the same period. Imports to South Korea also declined by -8.7% y-o-y to 3.8 mln t.
Let’s now focus on Mainland China, which is now the largest importer of LPG in the world. In Jan-Dec 2023 LPG imports into China surged by a spectacular +24.6% y-o-y to 31.2 mln tonnes. This was followed by a +11.7% y-o-y increase in Jan-Dec 2024 to 34.8 mln tonnes. Top LPG discharging ports in China in Jan-Dec 2024 were: Yantai (4.0 mln t in Jan-Dec 2024), Ningbo/Zhoushan (3.8 mln t), Dongguan (2.7 mln t), Dongjiakou (1.9 mln t), Beilun (1.6 mln t), Fuzhou (1.5 mln t), Panjin (1.4 mln t), Tianjin (1.3 mln t), Qinzhou (1.3 mln t), Zhuhai (1.2 mln t), Longkou (1.2 m t). Surprisingly, given the ongoing political tensions, the major source of LPG for China are still very much the United States”.
“In Jan-Dec 2024, China imported 19.6 mln tonnes of LPG from the USA, up +32.1% y-o-y. The USA accounted for 56.4% of China’s total seaborne LPG imports in Jan-Dec 2024. Houston was the top export port for LPG to China, with 12.3 mln t loaded there for destination China in 2024. In the first half of 2025, volumes from the USA have however corrected down by -11.0% y-o-y to 8.2 mln tonnes. The USA still account for 47.9% of China’s imports. When it comes to other sources of LPG, it is primarily the Middle East which in 2024 accounted for a combined 37.1% of the LPG imported into China. Most of this was from the UAE, which was the source of 3.7 mln tonnes or 10.6% of the total LPG imported to China in 2024, and Qatar with respectively 2.5 mln tonnes and 7.0%. Imports from Iran have also surged, increasing by +55.4% y-o-y in 2024 to 3.4 mln tonnes, or 9.7% of China’s total imports. In Jan-Jun 2025, volumes from Iran further increased by +38.7% y-o-y to 2.8 mln tonnes and now account for 16.4% of China’s imports this year. From the UAE volumes increased by +4.9% y-o-y in 1H 2025 to 2.1 mln t, and from Qatar by +26.2% y-o-y to 1.4 mln tonnes,” the shipbroker concluded.
Source: Hellenic Shipping News Worldwide